POWER MONITORING DEVICES
ENERGY INTELLIGENCE
The Internet of Things, or IoT, are billions of devices around the world that are now connected to the internet collecting and sharing data. IoT is radically transforming building operations and asset performance with high quality, dynamic real-time data across thousands of assets.

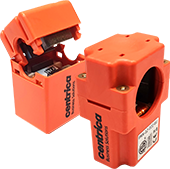
Self-powered maintenance free sensors collect real-time data.
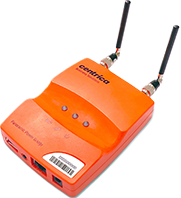
Data is collected locally and transmits every 10 seconds via Cellular, WIFI or LAN

The data is harvested via the Cloud to the energy dashboard
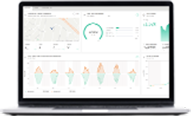
PowerRadar™ is an easy to use dashboard allowing full visibility across the entire energy consumption.
Typically, energy management systems require the extensive installation of cabling, communication, and hardware often with significant downtime to day-to-day operations. A Paramount Energy solution uses remote wireless sensors that simply attach to the cables, are self-powered and maintenance-free. The installation is quick and uncomplicated with no interruption to your operations. Data is accurately captured down to device level and exported to the interactive dashboard.
PowerRadar™ is a wireless cloud based IoT analytics platform that enables access to real-time data about the energy on the consumption and performance of your buildings and assets. The dashboard is an easy-to-use web-based platform that can provide real-time and historical data of energy consumption, power, volts, costs, equivalent CO2 emissions, benchmarking, heat map, predicted energy consumption, peaks and anomalies.
The PowerRadar™ dashboard offers a single view into your energy profile. It displays your energy consumption and operational health at a glance. Easily navigate around the powerful functionality to monitor, analyse, export data, trend analysis and utilize rules and alerts.
PowerRadar™ can be accessed from your PC, tablet, or mobile device via the app.
ENERGY MONITORING SYSTEM
PowerRadar™Offers
- Easy to use navigation
- Multi-user logins
- View multiple sites from one dashboard on desktop or mobile
- Detailed analytical reports packages
- Incorporate electricity, water & gas into one view

Email/Push Notification
Notify your owners / tenants via our Email and Push Notification options
PowerRadar App Available in the


Time View
provides a look at the detailed power and energy consumption of the site. Data can be viewed by Zone, Panel, Device, and Electrical Hierarchy & Time periods. Overlay previous consumption periods, ambient temperature or operating hours to access true analytical functionality.

HEAT MAP
The consumption of energy is represented as a "heat" intensity map, with higher consumption shifting towards red and lower consumption shifting towards green. This feature helps easily identify abnormal out of hours operations

Benchmarking
This function will compare consumption performance between sites, circuits, or individual devices. Data can be viewed in

Energy Flow
The consumption of the selected site is presented as a Sankey diagram, showing the flow of energy between the different device categories, device types and individual devices. The width of the flow represents the amount of energy.

Reporting
The energy reports function creates simple to read, detailed graphical representations of the consumption performance of your site or asset. Reports can be automated and sent periodically to multiple stakeholders. Reports can be set to Single and multi-site energy consumption to record energy tracking across assets and complete portfolios.

Specific customized reports can also be created to meet individual client requirements.
Rules and Alerts
Rules and alerts help a business ensure smooth operations and identify exceptional events and faults. We can create detailed rules-based alerts that will trigger by pre-set events, like unnecessary power consumption, unplanned on/off equipment operations or over current incidents. Rules can be configured on consumption, state, status & threshold limits to automatically send critical and non-critical notifications for improved operational efficiencies. Alerts are delivered via email or via push notification via the PowerRadar™ app. Contact Paramount Energy Services for more information.
Cost management and operational efficiency have never been more important for organisations in the modern business environment. Organisations are increasingly upgrading to a ‘smart infrastructure’ to access real-time operational data so that decisions can be made based on transparent and comprehensive data. This energy intelligence is creating powerful opportunities for organisations to better manage energy consumption and costs. Whether it is reducing costs, improved efficiency, compliance or reducing carbon emissions, a Paramount Energy EMS solution is at the core of an effective energy management strategy.


PARAMOUNT ENERGY SERVICES
CAN PROVIDE THE SOLUTION TO DELIVER BENEFITS FOR YOUR BUSINESS
View, analyse and record real-time energy consumption, generation, savings, and carbon emissions
Understand your whole energy footprint clearly
Eliminate inefficiencies and costs to your business
Real-time data to make informed ROI decisions and create ongoing energy strategies.
Build sustainability into your portfolio
Comprehensive reporting and dynamic alerts to inform and protect your assets
YOUR FREQUENTLY ASKED QUESTIONS
Everything you need to know about energy consumption monitoring,
all in one place.
“You can’t improve what you do not measure”, is a well-known business quotation.
Energy monitoring provides visibility on the entire consumption profile across all your buildings and devices to fully understand your energy footprint. This powerful data highlights in detail how your building consumes energy and helps owners and facility managers to implement effective change and improvements.
Organisations worldwide are implementing comprehensive energy management strategies as part of a drive to build sustainability and resilience into businesses. An EMS system forms an integral part of an energy management plan with highly detailed real-time energy monitoring data. Energy monitoring is key to conserving energy, uncovering energy saving potential and ultimately saving money.
A Paramount Energy EMS solution can benefit your business in several important areas:
Measure Performance
Consistently monitor all areas of your energy consumption. Track upward or downward trends to confirm or highlight predicted performance and costs. Record improvement over-time to help refine future business decisions.
Energy Savings
Take a proactive approach to identifying and isolating energy waste across your business. Eliminate inefficiencies and waste to drive down consumption and subsequent costs to the business. Energy consumption data will clearly highlight inefficiencies in equipment performance and usage. For instance, predictive data will highlight excessive heating or cooling operation outside of normal operating hours. Benchmarking is also an important method of comparing devices to make certain zones and sites are performing comparatively to each other.
Reduce Carbon Emissions
Implementation of an effective energy management plan will decrease energy consumption and reduce carbon emissions. This is key in helping businesses meet sustainability and de-carbonizing goals.
Optimize operations
Have the ability to quickly identify when equipment or systems are not operating efficiently, gives owners and operators the intelligence needed to take proactive action steps. Easily identifying declining performance or operational weaknesses can mean rectification works can take place instantly, so your asset operates optimally. Reduce or eliminate costly downtime of equipment by ensuring equipment is performing correctly and as per manufacturer’s data.
Using detailed trend data to drive more cost-effective maintenance programs by pre-empting potential problems and remain operational.